Novelties and Anomalies as Outliers
Spotting the statistical outliers is relevant for detection of novelties (e.g., a yet unknown object) and anomalies (e.g., a production error).
Suppose that you have only seen images of cars. Cars are the inliers. Now you want to know when objects are different from cars. These are the outliers.
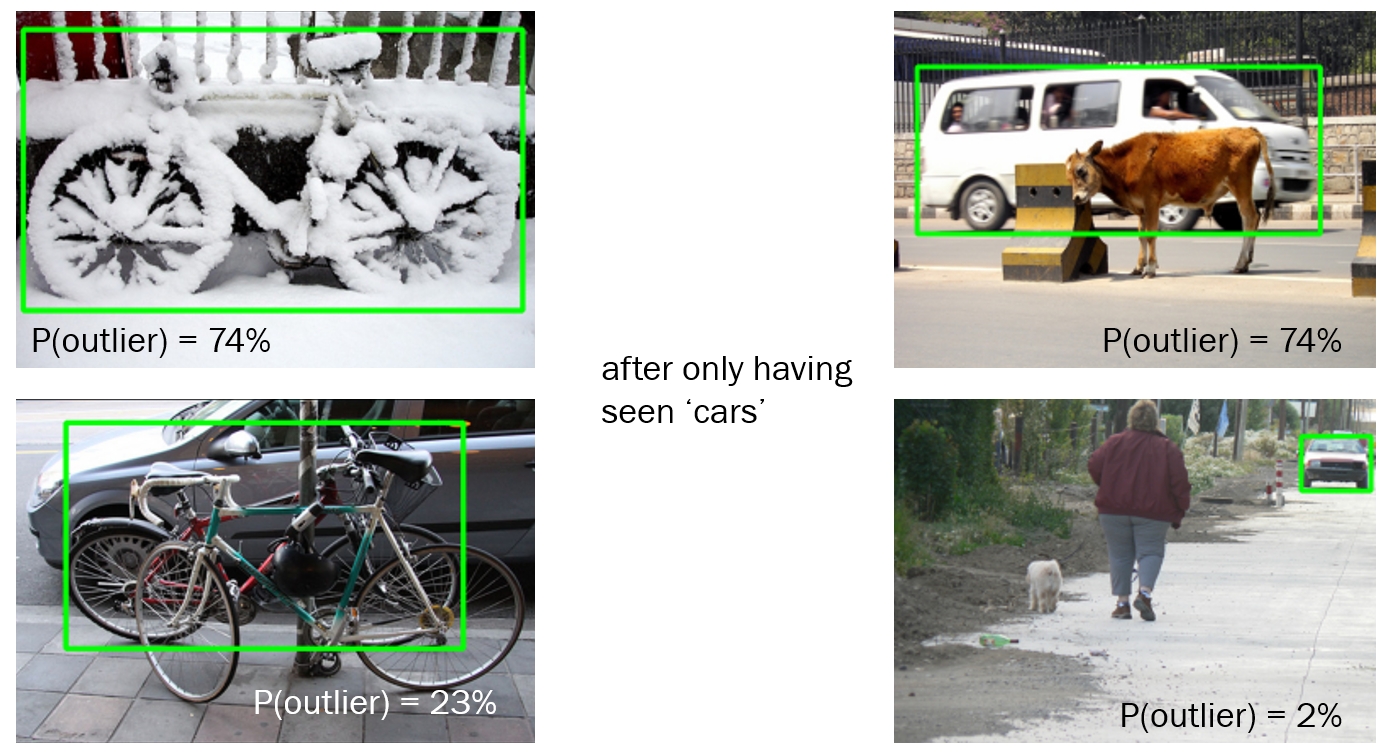
In the image above, the lower-right shows the strongest inlier. Correct, because it is a very standard image of a car. The image in the upper-right shows the weakest inlier. Understandable, it is a very deviating image of a car, because there is a cow in front of it. The image in the lower-left shows the weakest outlier. This is funny: there is a car behind it, so it looks a lot like the inliers. The image in the upper-left shows the strongest outlier. That makes sense, because this image is indeed very different from a car: a bicycle covered in snow.
This method is based on image features, extracted by a standard convolutional neural network (Resnet-50 pretrained on Imagenet), and the ‘bagging’ model to determine the probability of outliers (pyod package). The images are from the Pascal VOC dataset. The shown test images were not seen by the model during training.